Note
Go to the end to download the full example code.
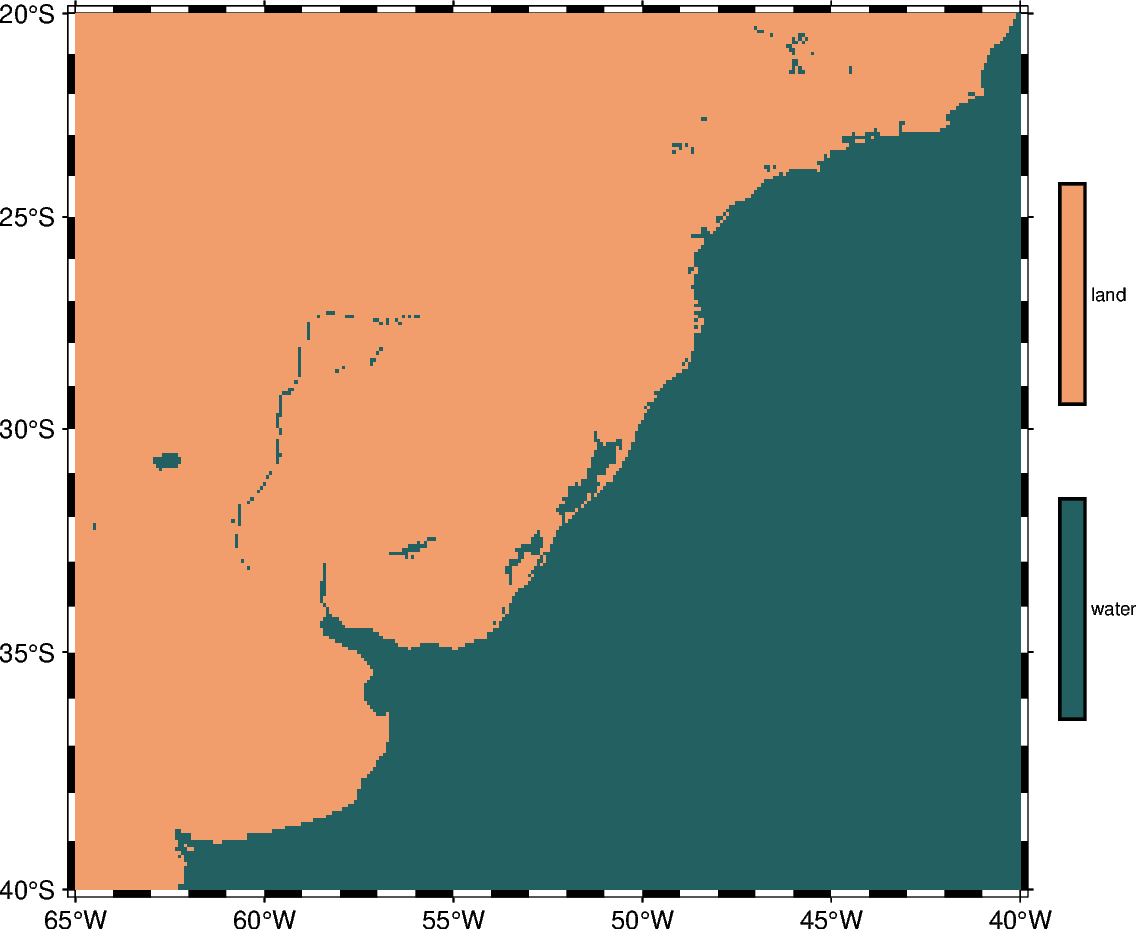
Create ‘wet-dry’ mask grid
The pygmt.grdlandmask function allows setting all nodes on land or water to a
specified value using the mask_values parameter.
grdimage [WARNING]: Your CPT is categorical. Enabling -nn+a to avoid interpolation across categories.
import pygmt
from pygmt.params import Position

fig = pygmt.Figure()

# Define region of interest
region = [-65, -40, -40, -20]

# Assign a value of 0 for all water masses and a value of 1 for all land masses. Use
# shoreline data with low resolution and set the grid spacing to 5 arc-minutes in x-
# and y-directions.
grid = pygmt.grdlandmask(
    region=region, spacing="5m", mask_values=[0, 1], resolution="low"
)

# Plot clipped grid
fig.basemap(region=region, projection="M12c", frame=True)

# Define a colormap to be used for two categories, define the range of the new discrete
# CPT using series=(low, high, interval), use color_model="+cwater,land" to write the
# discrete color palette "SCM/batlow" in categorical format and add water/land as
# annotations for the colorbar.
pygmt.makecpt(cmap="SCM/batlow", series=(0, 1, 1), color_model="+cwater,land")

fig.grdimage(grid=grid, cmap=True)
fig.colorbar(position=Position("MR", cstype="outside", offset=(0.5, 0)), length=8)

fig.show()
Total running time of the script: (0 minutes 0.150 seconds)